
Why you must measure ROI differently for BI projects
BI projects are not like buying a server or licencing a piece of desktop software. Their value is often operational and decision-based rather than purely transactional. Some typical outcomes include:
Time savings (reporting automation → analyst hours freed)
Faster decision-making (shorter lead times to action)
Cost avoidance (reducing overstock, ad spend waste)
Revenue uplift (better targeting, improved retention)
Risk reduction and compliance (fewer fines, better audit readiness)
Because benefits are a mix of direct (hard dollars) and indirect (time saved, speed of insight), an ROI model must be explicit about assumptions and timeframe. Typical BI ROI cases use 12–24 month windows for realistic payoff.
The simple ROI framework
At its simplest:
ROI (%) = (Net Benefit / Total Cost) × 100
Where:
Net Benefit = Total Benefits − Total Costs
Total Benefits = sum of quantified gains over the chosen period (e.g., 12 months)
Total Costs = all implementation + operating costs over the same period
Next we’ll break down what to include in benefits and costs so nothing meaningful is missed.
What to include in Total Costs (TCO)
When calculating TCO for BI consulting and data integration, include both one-time and recurring items. A comprehensive list:
One-time / Implementation costs
Consulting fees (requirements, modeling, dashboard design)
Data integration work (ETL pipelines, data warehouse modeling)
License setup fees (if any) and initial environment provisioning
Development and QA (PBIX creation, DAX measures, templates)
Training and enablement (user onboarding, CoE setup)
Recurring / Operational costs (12–24 months)
BI licensing (Power BI Pro/PPU or Premium capacity; or vendor-equivalent)
Cloud/warehouse compute for ETL, storage, and query (Snowflake, BigQuery, Synapse)
LLM/API spend for AI features if using copilots or augmented analytics
Support & maintenance (developer hours, monitoring)
Incremental security/compliance costs (sensitivity labels, DLP tooling)
Cost of change management and internal staffing (CoE staff time)
Hidden/one-off migration costs
Data migration from legacy systems
API connector work and vendor integration fees
Migration consultants for platform switches
Record costs by month where possible — this lets you discount or annualize accurately if your finance team asks for NPV or payback periods.
What to include in Total Benefits
Benefits should be conservative and measurable. Typical categories and examples:
Labor savings
Hours saved per month for analysts, managers, and finance teams by moving from manual reports to automated dashboards.
Value = (Hours saved × Hourly cost) × months.
Revenue uplift
Incremental sales tied to better targeting, personalized offers, or faster campaign adjustments.
Value = Incremental revenue attributable to BI changes over period.
Cost avoidance / efficiency
Reduced ad waste from improved attribution, lower inventory holding costs from better forecasting.
Value = Estimated dollars avoided over period.
Faster & better decisions
Harder to quantify, but can be represented as reduced time-to-decision multiplied by decision impact (e.g., faster price changes avoiding markdowns).
Use pilot data to convert time-to-insight into dollars.
Risk reduction / compliance
Avoided fines, reduced audit hours, lower probability of costly incidents.
Value = expected cost reduction (probability × cost) over period.
Enablement / strategic gains
New revenue streams from product-embedded analytics or upsells enabled by analytic features.
Value = projected revenue from new product features attributable to analytics.
To be credible, tie each benefit to a measurement plan — a metric you will track post-deployment (e.g., monthly hours logged in analytics tools, percentage change in CPA, percentage reduction in stockouts).
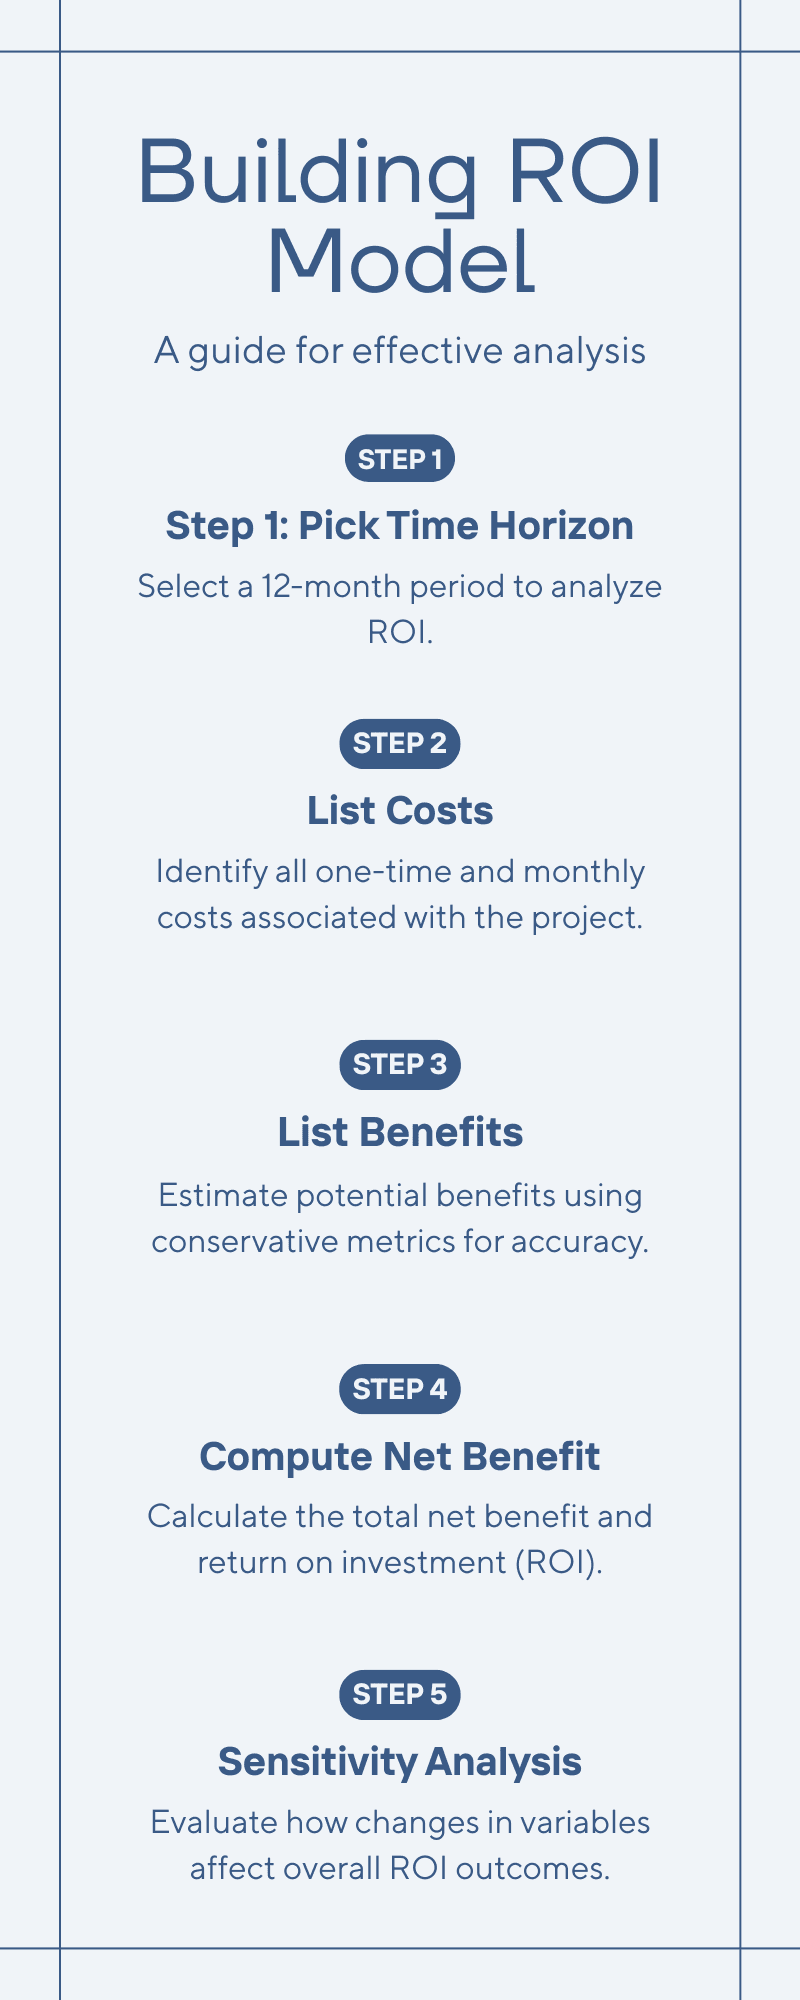
Building an ROI model — step by step
Step 1 — Pick a time horizon
Common choices: 12 months for quick wins, 24 months for enterprise programs. We'll use 12 months in the sample below.
Step 2 — List costs with months and one-time flags
Create a table with line items, unit costs, quantity, and monthly or one-time flags.
Step 3 — List benefits and conservative estimates
State the metric and the method used to compute the dollar value. Prefer to capture both conservative and stretch cases.
Step 4 — Compute net benefit and ROI
Use the ROI formula above. Also compute simple payback period: how many months until cumulative benefits exceed cumulative costs.
Step 5 — Sensitivity analysis
Vary key assumptions (hours saved, adoption rate, license price) to show best / base / worst cases.
Sensitivity & risk analysis
Key variables to stress-test:
Analyst hours saved (adoption).
Ad spend reduction percentage.
Incremental revenue attributable to BI.
License or cloud cost increases.
Unplanned migration or integration costs.
A quick sensitivity table (examples):
Variable | Base | -25% | -50% |
|---|---|---|---|
Analyst hours saved/month ($) | 19,200 | 14,400 | 9,600 |
Total Benefits (annual) | 470,400 | 380,400 | 320,400 |
Net Benefit (annual) | 355,760 | 265,760 | 205,760 |
ROI (%) | 310% | ~232% | ~180% |
Even with conservative reductions, BI initiatives with notable automation and attribution gains tend to have strong positive ROI; but you have to be clear and conservative with projections when you're reporting to finance.
How dashboards, governance and vendor choice affect ROI
Dashboards & adoption: The number one driver of realized benefit is user adoption. The How to Build a Power BI Dashboard approach (clear KPIs, simple layouts, drillthroughs) increases consumption and thus time-saved metrics that feed ROI. Well-designed dashboards translate modeling work into measurable time savings.
Data governance: Proper governance reduces rework, conflicting metrics, and compliance risk — lowering hidden costs. Investing in governance (sensitivity labels, certified datasets) reduces the probability of costly incidents and improves trust so users act on insights.
Platform choice & TCO: The platform you pick affects license cost, embedding fees, and engineering effort. Comparing options (Power BI vs Tableau vs Looker) early helps you select a tool that aligns with your skills and budget; misaligned choices inflate migration or training costs later.
Integrate these considerations into your ROI model by adding adoption ramp timelines, governance staffing costs, and potential migration contingencies.
Practical validation plan (90 days)
To make the ROI believable, validate assumptions quickly:
0–30 days
Baseline measurement: current manual reporting hours, ad spend waste estimate, and revenue cycle.
Choose a single high-impact dashboard (e.g., campaign performance + attribution).
30–60 days
Implement the dashboard with tight scope (one data source, core KPIs, automation of one manual report).
Track adoption (logins, report views, saved exports) and time saved by end-users via surveys and time-tracking.
60–90 days
Measure early impact on ad spend decisions and revenue attribution. Update ROI model with real numbers and present an interim business case to sponsors.
This incremental approach reduces risk and turns assumptions into measured inputs for the finance team.
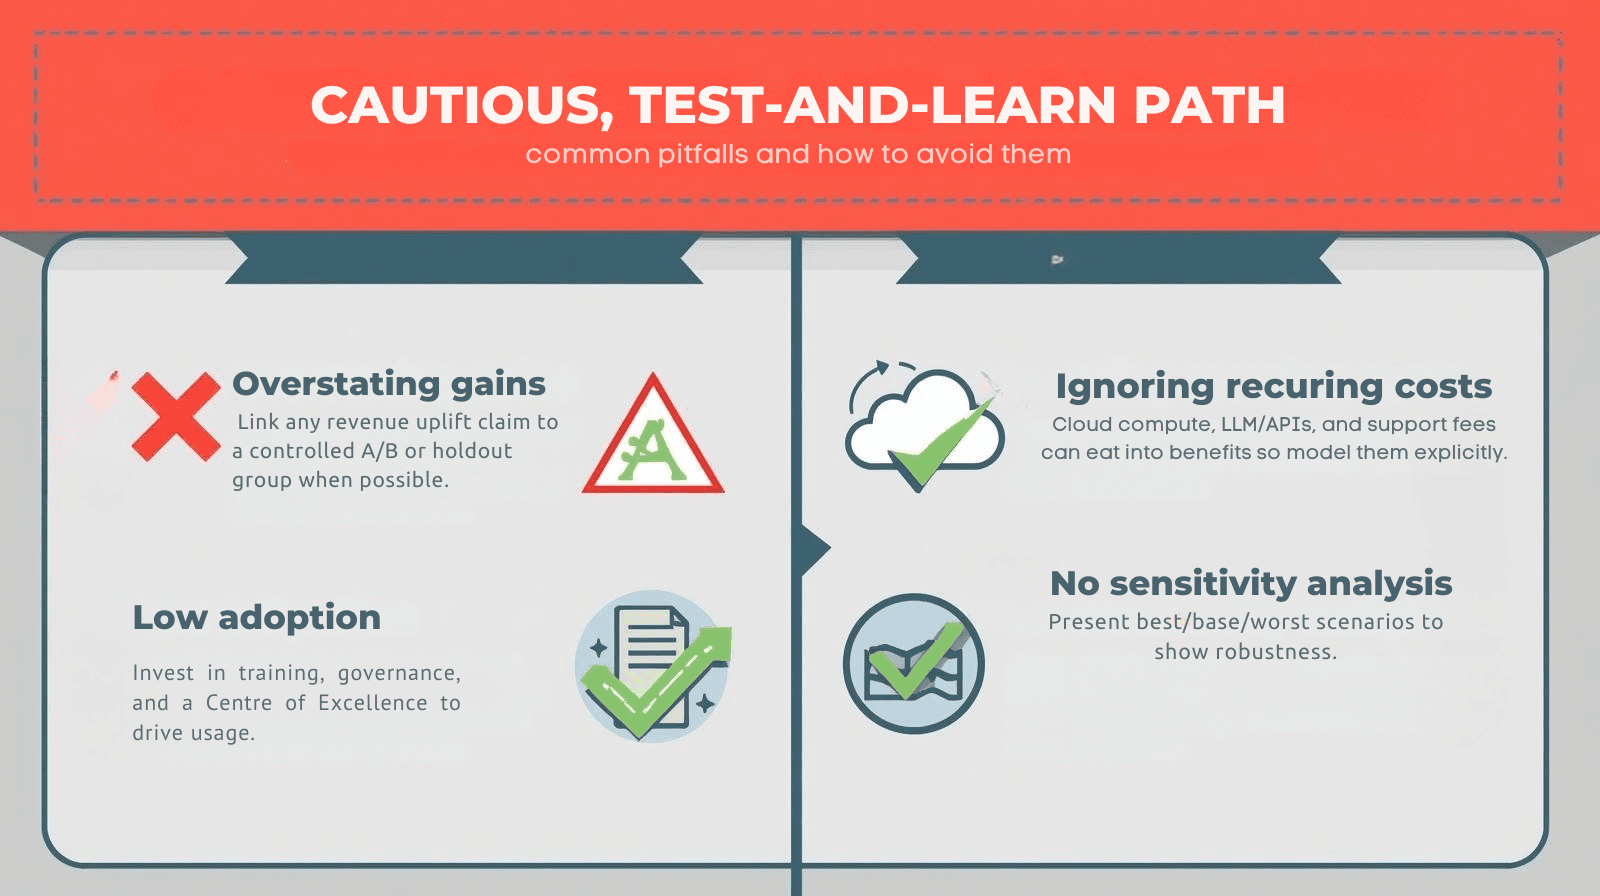
Common pitfalls and how to avoid them
Overstating attribution gains: Link any revenue uplift claim to a controlled A/B or holdout group when possible.
Ignoring recurring costs: Cloud compute, LLM/APIs, and support fees can eat into benefits so model them explicitly.
Low adoption: Invest in training, governance, and a Centre of Excellence to drive usage.
No sensitivity analysis: Present best/base/worst scenarios to show robustness.
A believable ROI for BI consulting and integration of data links tangible operating metrics (hours saved, ad spend decreased, incremental revenue) to transparently detailed costs (implementation, licences, cloud, support). Take a cautious, test-and-learn path: test assumptions expediently with a targeted pilot, quantify adoption and actual results, and refine the financial model. Where dashboards are well planned, governance exists, and platform selection fits your stack, BI initiatives tend to yield fast payback and high year-one ROI — and they pave the way for scaled, reliable analytics across the business.