Why 2025 feels different for BI
In 2024 enterprises experimented widely with generative AI; in 2025 we’re seeing the follow-through: AI is being embedded into BI workflows (from data prep to insight delivery), and platform vendors are packaging these capabilities into productized experiences and orchestration layers. Industry analysts and vendor roadmaps point to a shift from experimentation to production-ready, governed BI systems.
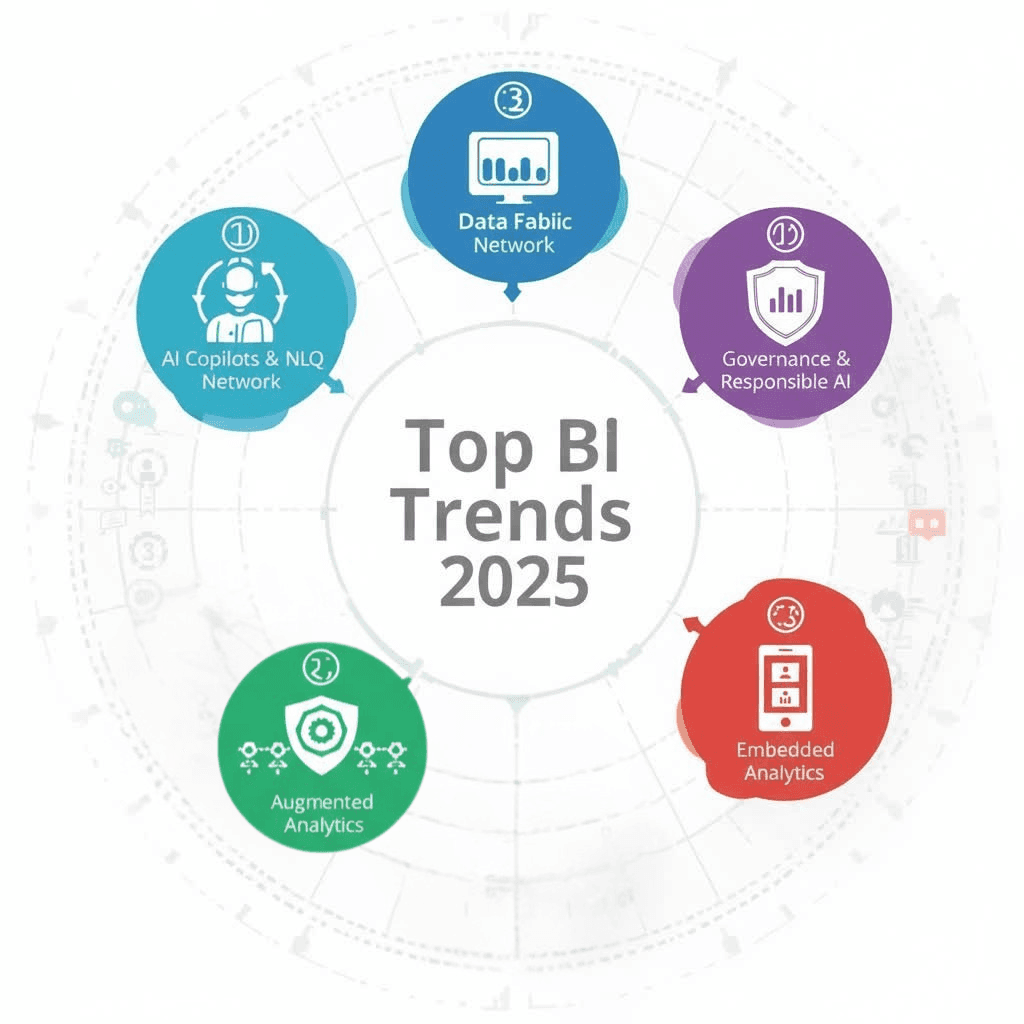
The five headline trends for BI in 2025
AI copilots and natural-language insights - BI tools now ship conversational assistants that let business users ask questions in plain English and receive narratives, visuals, or DAX/SQL snippets.
Data fabric & platform consolidation (Fabric) - vendors are integrating storage, compute, governance and AI into unified “fabric” platforms to reduce friction between teams and tools
Augmented analytics goes mainstream - automated insight discovery (anomaly detection, auto-ML, smart viz recommendations) moves from niche to default product capabilities.
Governance, trust & responsible AI - as more decisions rely on AI-generated recommendations, governance, model auditing and lineage become core procurement criteria
Embedded and composable analytics - product teams demand analytics that can be embedded into apps, and companies expect analytics platforms to be buildable with their data stack (warehouses, lakes, streaming).
Trend table — quick at-a-glance
Trend | What it changes | What to plan for |
|---|---|---|
AI copilots & NLQ | Business users get answers via chat; analysts accelerate workflows | Conversation UX, guardrails, costs for LLM usage |
Data Fabric (platforms) | Consolidates storage, compute, governance, and AI | Evaluate vendor lock-in vs. integration flexibility |
Augmented analytics | Auto-insights, anomaly detection, auto-visualization | Invest in data quality and observability |
Governance & responsible AI | New controls for lineage, explainability, audit | Policies, model registries, compliance checks |
Embedded analytics | Analytics inside products and portals | API limits, embedding licensing, latency SLAs |
Deep dive: AI copilots & natural-language insights
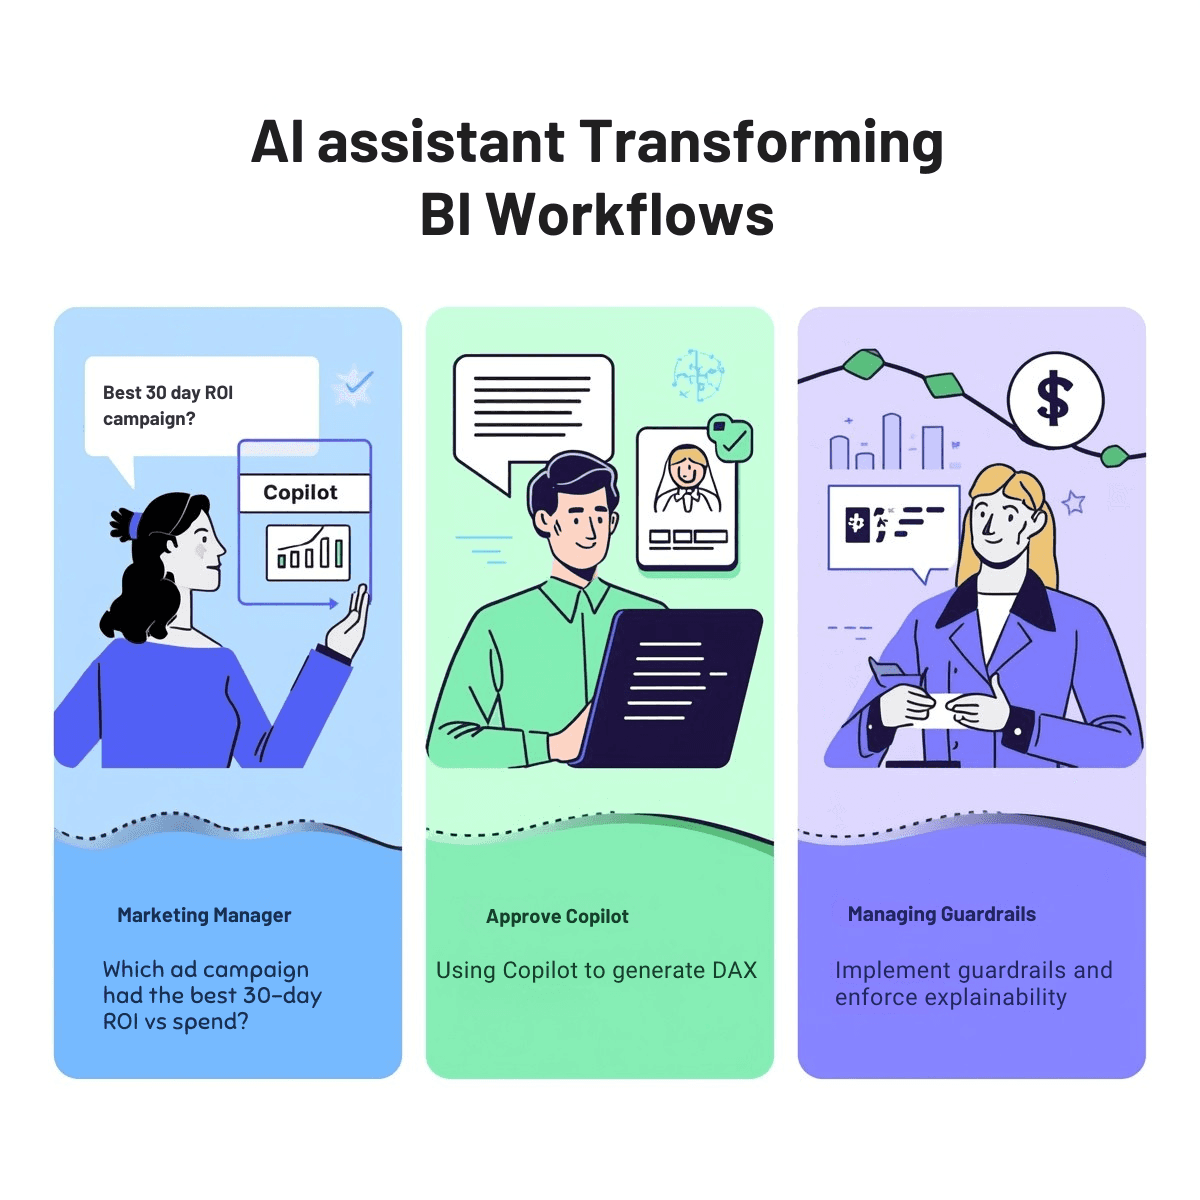
What’s new: Copilot-style assistants are being embedded directly into BI platforms (lookups, narrative outputs, DAX/SQL generation, and multi-step analysis flows). These agents let a marketing manager ask, “Which ad campaign had the best 30-day ROI vs spend?” and get an annotated visual plus next-step recommendations. Microsoft’s Copilot features in Power BI and Fabric are a prominent example of this direction.
Why it matters: This lowers the barrier to insights for non-technical users and accelerates analysts’ productivity by automating repetitive tasks (measure creation, anomaly explanation, query generation).
Risk & mitigation: Excessive dependency on generated insights without verification can be dangerous. Implement guardrails: enforce explainability, compare model-driven results with baseline rules, and implement human-in-the-loop approvals for acting upon high-impact recommendations.
Deep dive: Data fabric and the new platform question
What is a data fabric? A data fabric is intended to unify data management — tying storage, compute, metadata, and governance together so groups can find, access and use data across environments with uniform policies. Microsoft's Fabric productization is one example where storage, compute, and AI capabilities are being packaged for adoption.
Why it matters now: As analytics moves from departmental reports to enterprise decision systems and embedded experiences, the friction of “where is the data?” and “who owns this model?” becomes a primary blocker. A fabric reduces duplication, speeds up discovery, and centralizes governance.
What to evaluate: Integration with your warehouse (Snowflake/BigQuery/Azure Synapse), cross-environment lineage, cost model for compute & storage, and the degree to which the fabric locks you into a vendor.
Deep dive: Augmented analytics — not magic, but multiplied effort
Definition: Augmented analytics uses machine learning and natural language technologies to automate insight generation (trend detection, root-cause, forecasting, causal inference recommendations). Vendors are integrating these features across the product lifecycle: data prep, modeling, visualization, and narrative generation.
Practical benefits:
Faster anomaly detection and explanation.
Automated suggestions for best-fit visualizations and measures.
Democratized forecasting and scenario modeling for non-analysts.
Implementation tip: Augmented features depend heavily on data quality. Before enabling automated insights, invest in profiling, cataloguing, and clear ownership of source data.
Governance, trust & responsible AI.
Why governance is front-and-center: As AI begins to suggest actions (budget reallocations, supply chain prioritization), organizations must be able to explain how a recommendation was made, who owns the model, and whether the model is biased or stale. Analyst and vendor guidance in 2025 stresses governance, logging, and model registries.
Checklist for responsible BI:
Model lineage & versioning (who trained it, when).
Explainability & feature importance summaries.
Access controls & audit logs for automated recommendations.
Periodic accuracy and drift tests.
Embedded and composable analytics — analytics as product features
The incorporation of analytics into customer or internal products enhances stickiness and product value. Buyers anticipate in 2025:
Low-latency visualizations embedded in apps,
Single sign-on and row-level security across tenants, and
APIs to call models, run slices, or generate on-demand narratives.
Business advice: If embedding is a priority, measure latency, multi-tenant isolation, and the vendor’s embedding pricing model early in procurement. The cost of embedding can dominate TCO if not budgeted properly.
How these trends change vendor selection
If AI-first and Copilots are your priority, evaluate platforms with strong native generative capabilities and clear governance tooling. If centralized governance and a unified semantic layer are critical, model-first platforms or fabric-oriented vendors are attractive. If visualization-driven exploration matters more, prioritize tools with deep visual analytics and analyst UX. For a practical tool comparison, see our linked guide: **Power BI vs Tableau vs Looker: Which BI Tool Should You Choose in 2025? -**this breaks down which tools map to these priorities.
Adoption roadmap — 90-day to 18-month plan
0–90 days
Inventory current reports, data sources, and high-value KPIs.
Pilot an AI-assistant on a non-critical dataset to understand outputs.
Start a data catalog project (tag sources, owners, refresh cadence).
3–9 months
Run a cross-functional proof-of-value: one embedded analytic or one Copilot-enabled dashboard that saves time or improves a KPI.
Implement model registries and basic explainability checks.
Build a cost model for LLM/API usage and dataset refresh compute.
9–18 months
Roll out governance policies, model audit routines and training for users.
Consider fabric/platform consolidation if fragmentation is slowing delivery.
Launch product-embedded analytics where it creates revenue or retention improvements.
Practical measurements — what metrics to track
Business adoption: % active users, reports per active user.
Insight-to-action velocity: Time from insight generation to decision/action.
Model reliability: Drift rate, false positive rate on anomaly detection.
Cost metrics: LLM/API spend per insight; compute/storage cost per report.
ROI signals: Revenue or cost improvements traced to AI-assisted decisions (use our ROI model for structured calculations).
Q&A
Q: Are copilots going to replace BI analysts?
A: No — copilots amplify analyst productivity by handling routine tasks and hypothesis generation. Analysts will shift to higher-value activities like governance, causal inference, and storytelling.
Q: Is “Fabric” just vendor marketing?
A: Partly — the term is marketing-friendly, but it describes a real architectural trend: tighter integration of storage, compute, metadata and AI into cohesive platforms. Evaluate the actual capabilities (lineage, governance, integration) rather than the label.
Q: How do I prove ROI for AI in BI?
A: Start with a narrowly scoped POC that targets a measurable KPI (e.g., reducing manual reporting effort, improving forecast accuracy). Use before/after metrics and include the cost of LLM/compute in your TCO. Our ROI article has a template you can reuse.