This article covers:
A plain-language definition of Power BI
Core components and architecture
Who benefits from Power BI (use cases)
Quick comparison to other BI tools
How to get started (overview + linked tutorial)
FAQs and practical next steps (download, ROI link)
What is Power BI? (Simple definition)
Power BI is Microsoft's cloud-based and desktop suite of data analysis tools that enable organizations to connect to various data sources, shape and model data, and create interactive dashboards and reports. It's meant to provide access to data for both analysts and business users in the form of visuals, drag-and-drop, and natural-language queries.
Why businesses choose Power BI
Power BI is popular because it combines powerful analytics with ease of use and Microsoft ecosystem integration.
Key benefits:
Fast insights: Drag-and-drop visuals and built-in AI accelerate analysis.
Integration: Tight integration with Excel, Azure, Microsoft 365, and many databases.
Cost-effectiveness: Flexible licensing (free desktop, Pro, Premium) — attractive for SMBs and enterprises.
Scalability: From personal reports to enterprise deployments and governance.
Self-service & governed BI: Empowers business users while allowing IT to enforce data governance.
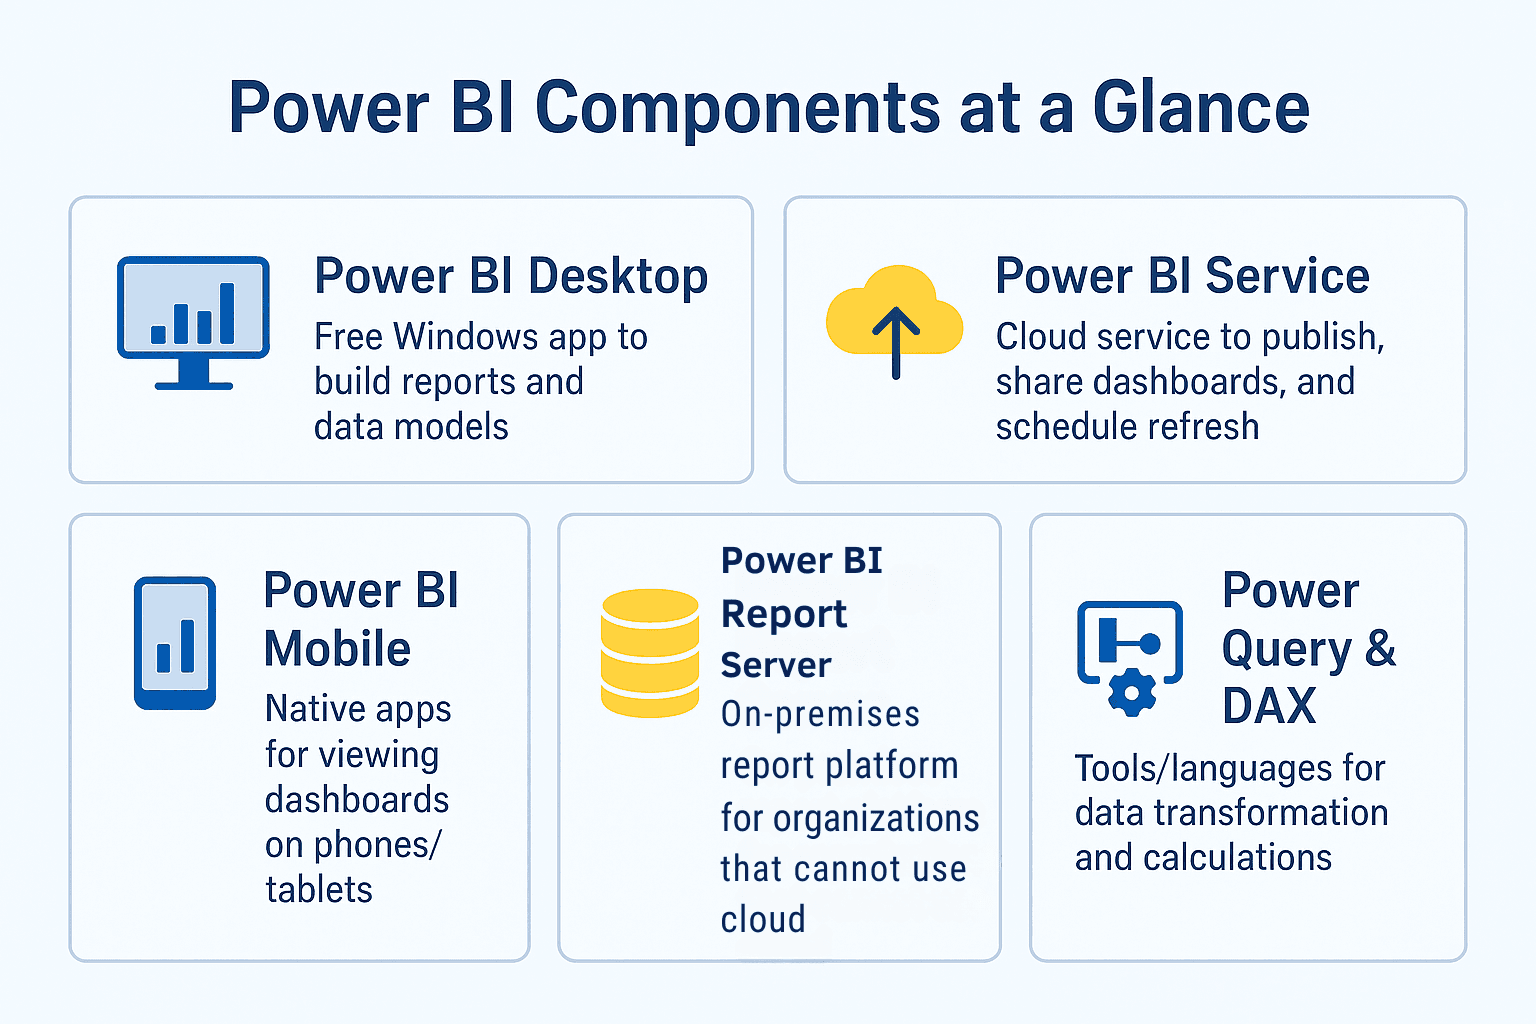
Power BI components (at a glance)
Component | What it does | Who uses it |
|---|---|---|
Power BI Desktop | Free Windows app to build reports and data models | Analysts, BI developers |
Power BI Service | Cloud service to publish, share dashboards, and schedule refresh | Business users, report consumers |
Power BI Mobile | Native apps for viewing dashboards on phones/tablets | Executives, field teams |
Power BI Report Server | On-premises report platform for organizations that cannot use cloud | Regulated industries |
Power Query & DAX | Tools/languages for data transformation and calculations | Data modelers, analysts |
Common Power BI use cases
Power BI is used across departments and industries. Typical scenarios include:
Marketing analytics: Campaign performance dashboards, channel attribution, and lead funnel visualization.
Sales performance: Quota attainment, pipeline analysis, churn risk scoring integrated with CRM.
Finance & FP&A: Budget vs actual, rolling forecasts, profitability analysis.
Operations & supply chain: Inventory, throughput, and vendor performance dashboards.
Customer support & product: Ticket resolution times, product usage metrics, feature adoption.
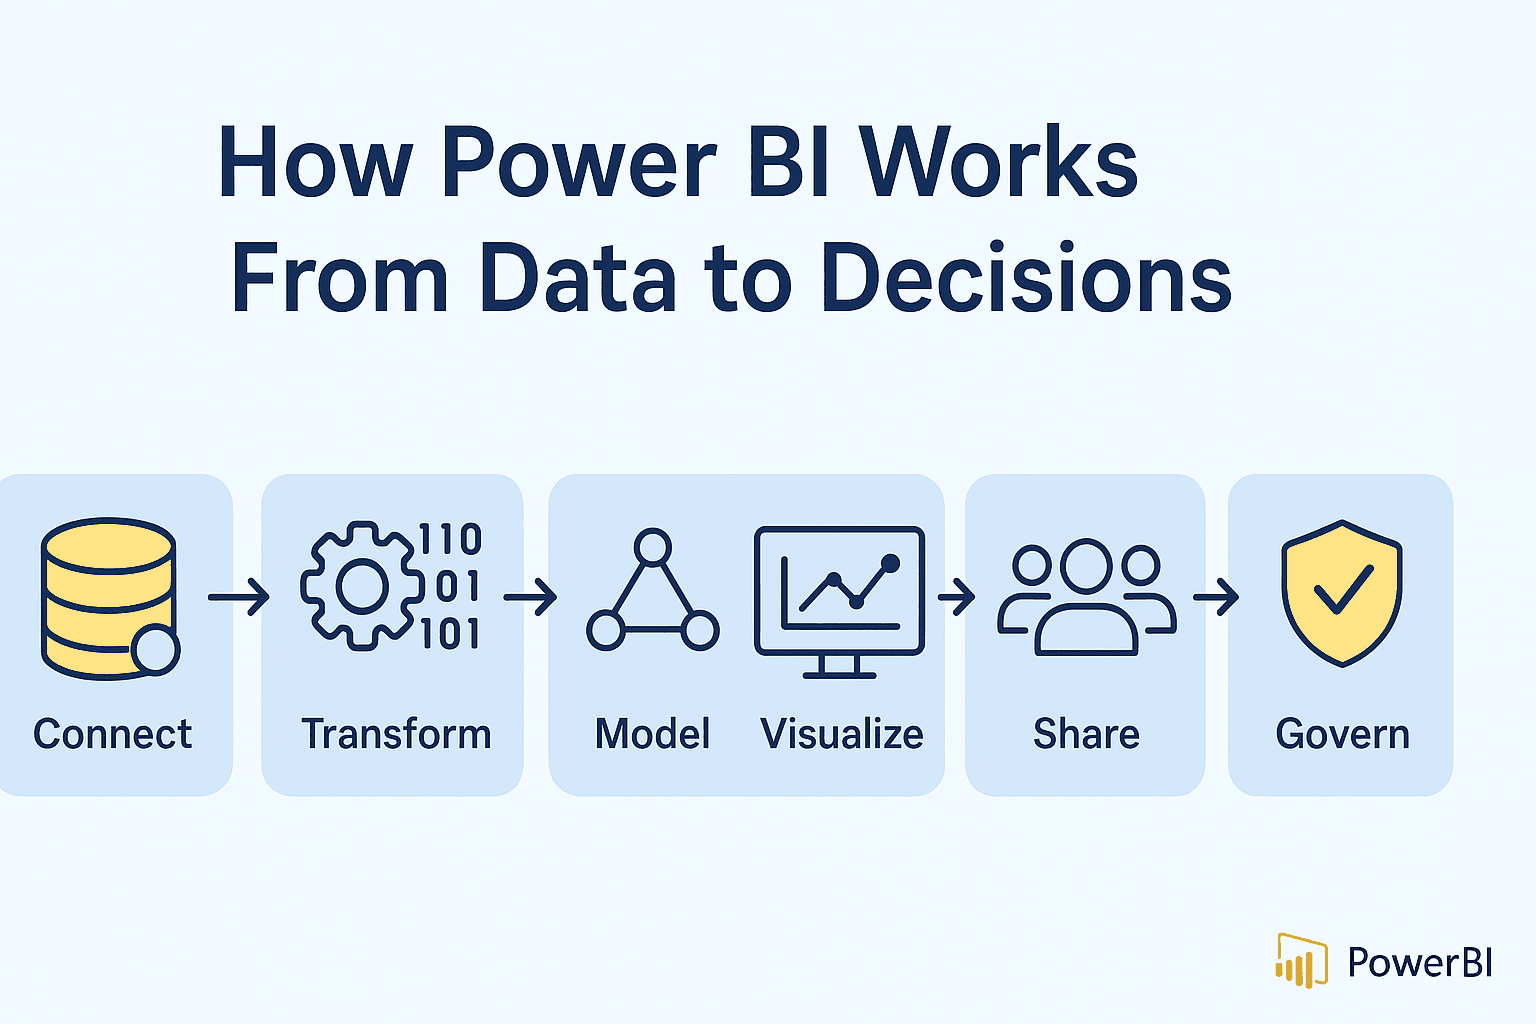
How Power BI works — the simple workflow
Connect to data sources (Excel, SQL, APIs, cloud apps).
Transform data with Power Query (clean, merge, pivot).
Model using relationships and DAX measures.
Visualize by building interactive reports and dashboards.
Share via Power BI Service or embed into apps/portals.
Govern with workspace capacities, row-level security, refresh schedules.
Building your first interactive report — quick start
You don’t need to be a data engineer to create a helpful report. Here’s a short checklist to go from raw data to a useful dashboard:
Identify the audience & KPIs. (e.g., weekly revenue, conversion rate, active users).
Prepare the data. Use Power Query to clean and join files/tables.
Build a star schema. Keep fact tables and lookup tables for better performance.
Create measures with DAX. Start with simple measures (sum, average, year-to-date).
Use visuals thoughtfully. Combine a headline KPI card with trends, breakdowns, and a table for detail.
Enable interactivity. Use slicers, drillthroughs, and bookmarks.
Publish & schedule refresh. Share to a workspace and set data refresh frequency.
Collect feedback & iterate.
FAQs
Q: Is Power BI free?
A: Power BI Desktop is free for report creation. Sharing requires Power BI Pro or a Premium capacity. Pricing varies by user and capacity needs.
Q: Do I need to know SQL to use Power BI?
A: No — Power BI supports point-and-click data prep via Power Query. However, SQL helps when pulling and optimizing large datasets.
Q: Can Power BI handle real-time data?
A: Yes. Power BI supports streaming datasets and DirectQuery/Live connections to show near-real-time data for dashboards.
Q: What are best practices for Power BI governance?
A: Use workspaces and roles, implement row-level security (RLS), document data sources, and manage refresh schedules and dataset sizes.
Q: How long before I see value from Power BI?
A: Small teams can get basic dashboards running in days; enterprise deployments with governance and data modeling can take weeks to months.
If you want a full walkthrough, check out the companion article: How to Build a Power BI Dashboard: Step-by-Step Tutorial.
Visual design and storytelling tips
Good dashboards are stories, not just charts. Use these rules-of-thumb:
One question per visual. Each chart should answer a single question.
Use hierarchy: Big KPI cards → trend charts → granular breakdowns.
Colors: Use consistent color palettes and avoid decorative clutter.
Annotations: Add short insights or callouts so readers understand the “so what.”
Mobile-first checks: Validate layout on Power BI Mobile — many users access dashboards on phones.
Measuring success — what to track
Track adoption and business impact, not just page views:
Adoption metrics: % of active users, report views per user, frequency of use.
Performance metrics: Dataset refresh success, query performance, load times.
Business KPIs: Reduction in time-to-insight, faster decision cycles, revenue uplift or cost savings attributed to the dashboard.
Next steps & resources
If you’re ready to move from learning to doing:
Start with Power BI Desktop (download from Microsoft).
Follow a step-by-step tutorial — see: How to Build a Power BI Dashboard: Step-by-Step Tutorial for screenshots, downloadable PBIX, and templates.
Download an executive dashboard checklist (one-page PDF) — including a sample star schema and KPI list.
Calculate ROI before a bigger roll-out: use our ROI calculator article Calculating the ROI of BI Consulting and Data Integration Services to justify investment to stakeholders.
Power BI is easy to learn but capable enough for enterprise-level analytics. This guide should inform you about whether Power BI meets your requirements and guide you to useful next steps — from creating your first dashboard to evaluating tools and computing ROI.