Data storytelling is more than just visualization. It’s about combining data analysis, compelling narratives, and engaging visuals to persuade, explain, and inspire. In 2025, with AI-driven analytics, Microsoft Fabric’s unified data ecosystem, and augmented analytics shaping the Business Intelligence (BI) landscape, storytelling has become an essential skill for both analysts and business leaders.
What Is Data Storytelling?
At its core, data storytelling is the practice of interpreting complex datasets and weaving them into a clear, relatable, and actionable story for a specific audience.
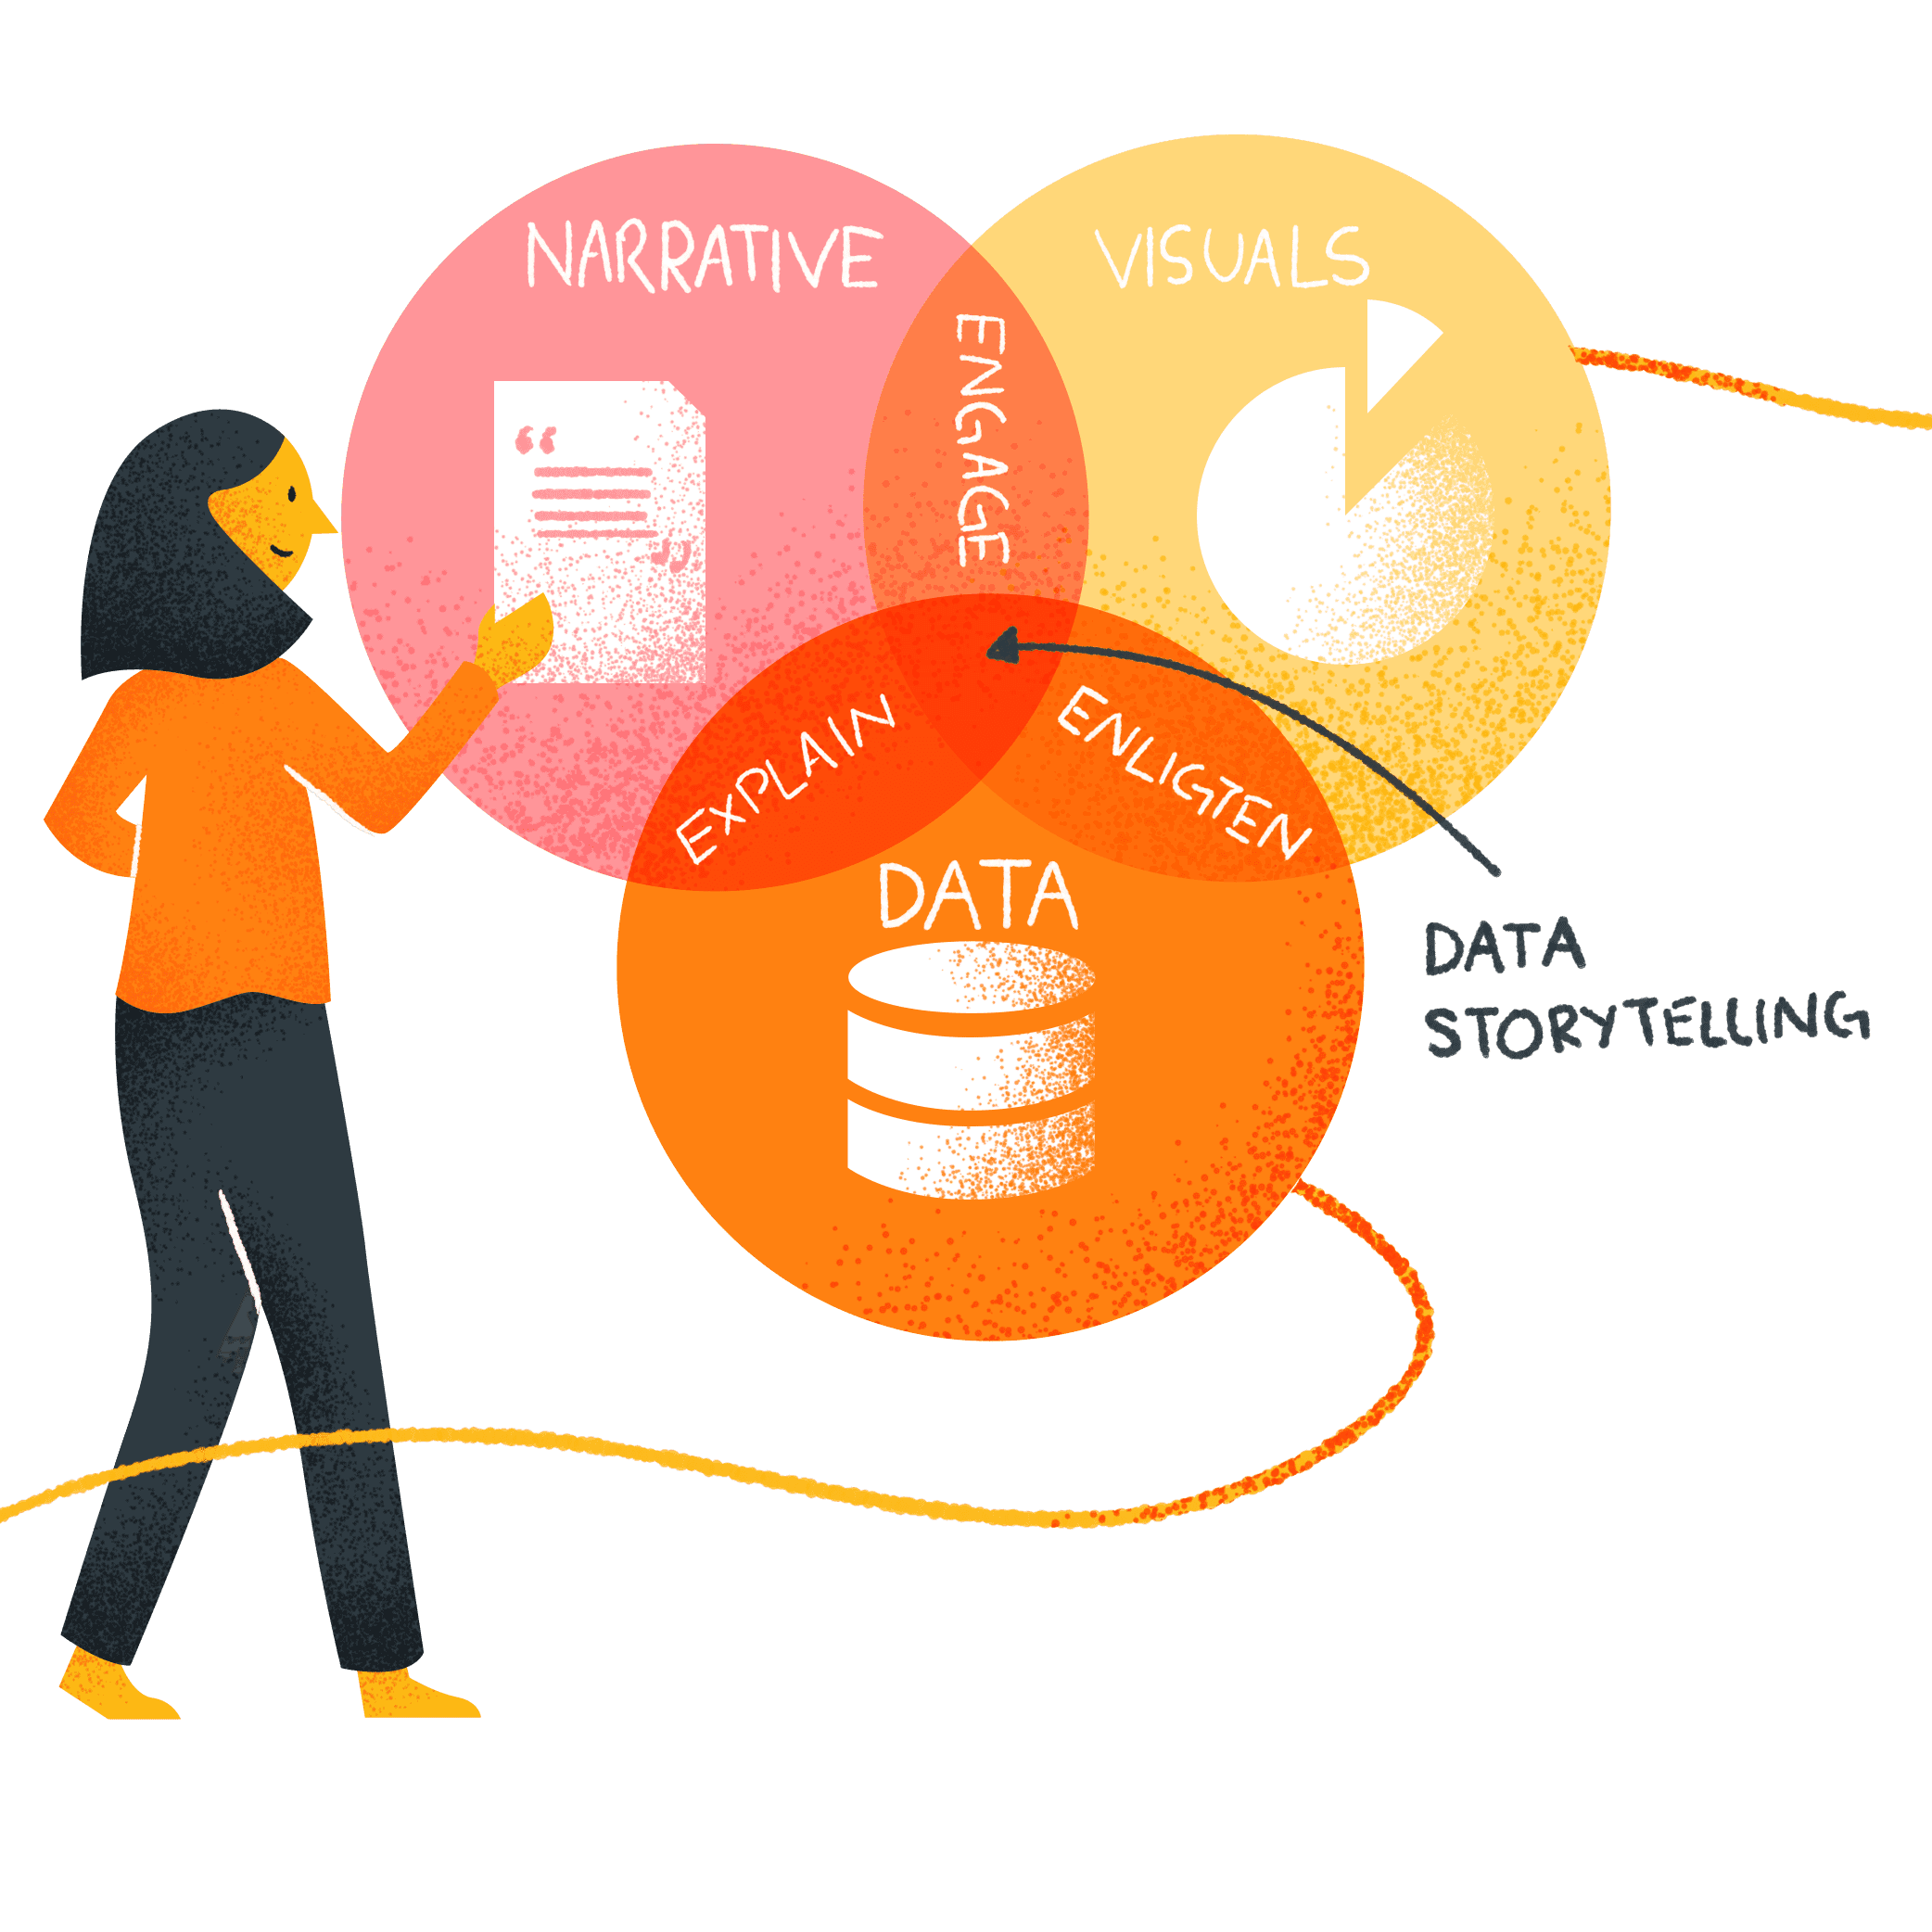
A good data story blends three core components:
Data - Accurate, relevant metrics from trusted sources.
Visuals - Charts, dashboards, and infographics that make patterns visible.
Narrative - A logical, emotionally engaging flow that connects the dots and answers “So what?”.
While tools like Power BI make it easy to build stunning visuals, it’s the story that ensures those visuals have real impact.
Why Data Storytelling Matters in 2025
The sheer volume of enterprise data is growing at an exponential rate. Yet, decision-makers don’t need more data: they need clarity.
Here’s why data storytelling is crucial:
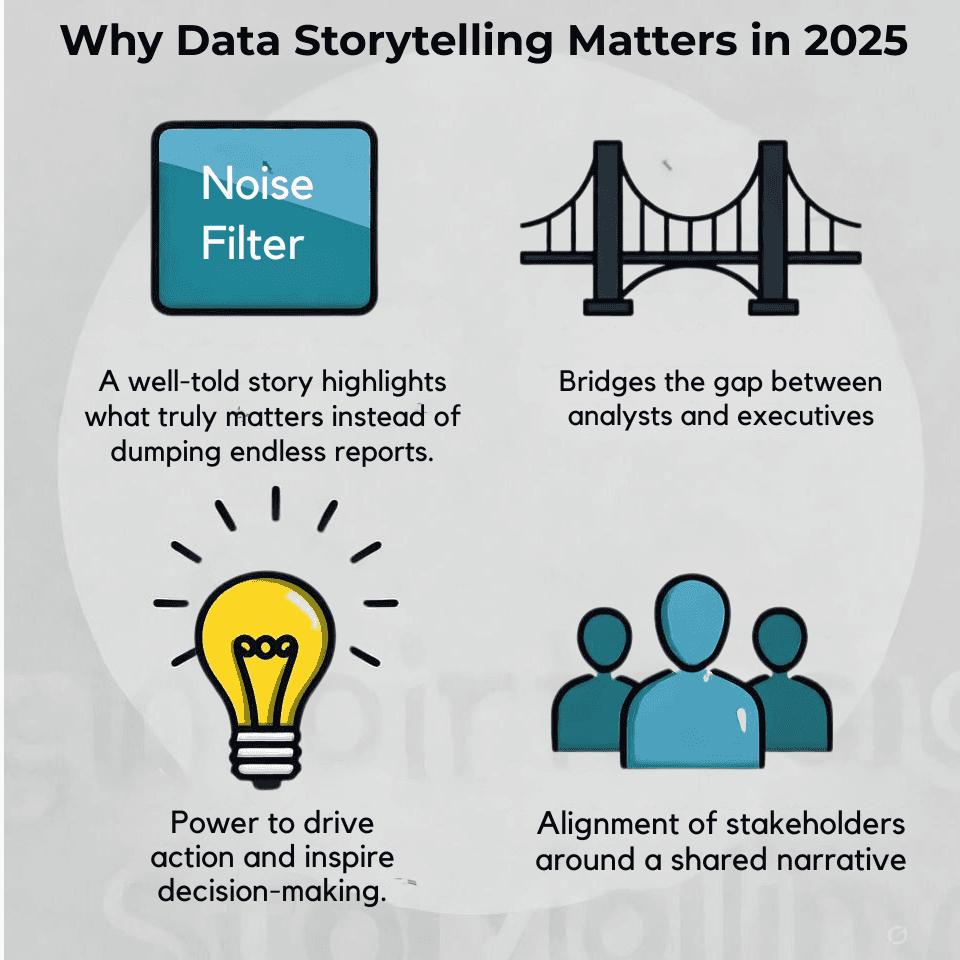
Cuts through noise - A well-told story highlights what truly matters instead of dumping endless reports.
Bridges the gap between analysts and executives - Translating technical findings into strategic decisions.
Drives action - People remember stories, not spreadsheets.
Aligns stakeholders - A narrative can unite teams around a single, data-backed vision.
As we’ve seen in discussions on Top Business Intelligence Trends for 2025, AI tools now assist in finding insights faster, but the human ability to contextualize and persuade remains irreplaceable.
The Anatomy of an Effective Data Story
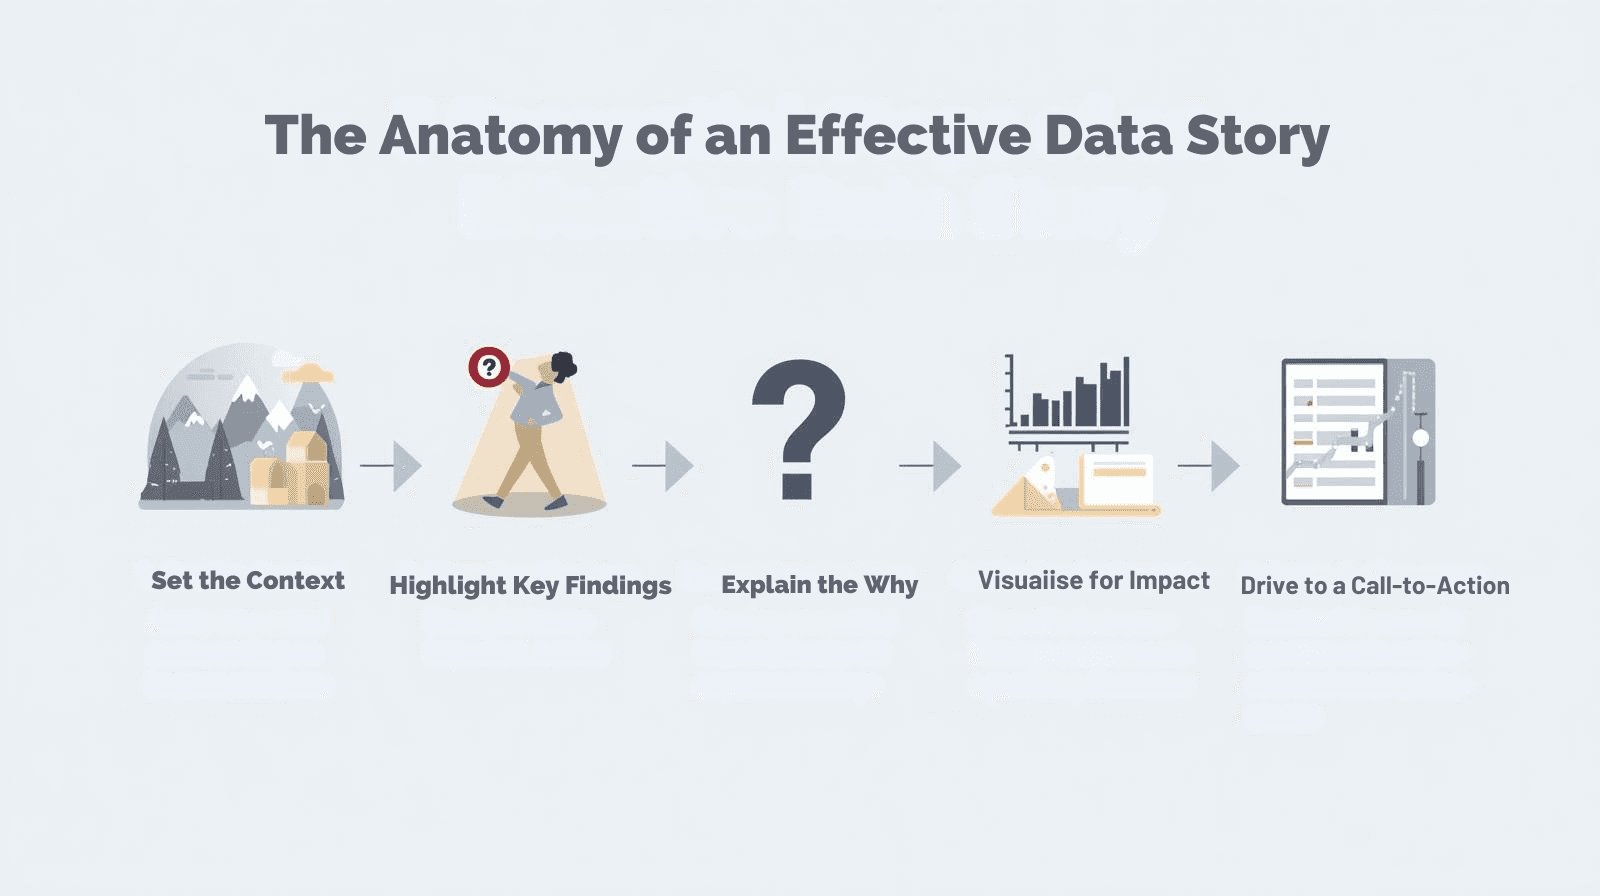
An impactful data story follows a structure similar to a compelling novel where the plot is built on “Numbers”.
1. Set the Context
Before presenting metrics, set the scene: Why is this analysis being done? What’s the business question? For example, a marketing analytics report might open with, “Over the past quarter, customer acquisition costs have risen by 15% — threatening our ROI goals.”
This stage is similar to the “problem statement” in a Power BI ROI Analysis article, where context determines the relevance of every number that follows.
2. Highlight the Key Findings
Don’t overwhelm the audience with everything you’ve found. Focus on the few insights that directly answer the business problem.
Example: “Paid search campaigns are 40% less cost-efficient than organic content strategies.”
3. Explain the ‘Why’
Numbers inform you what is occurring; the narrative tells you why. That's where analysis and investigative reasoning enter into play. Perhaps the higher CAC is because the market is saturated, or perhaps there has been a change in competitor bidding practices.
Here, a data warehouse provides historical trends for context, while integration pipelines bring in external datasets for comparison; the topics which we had already explored in Data Integration vs Data Warehousing.
4. Visualize for Impact
A great chart can turn confusion into clarity. Power BI offers:
Drill-through pages to explore details.
Bookmarks for scenario storytelling.
Custom visuals like decomposition trees to show cause-effect relationships.
5. Drive to a Call-to-Action
A story without a next step is just entertainment. End with a clear action:
“Shift 20% of ad budget from paid search to influencer partnerships.”
“Invest in customer retention campaigns for Q3.”
This transforms your story from interesting to operationally valuable.
Data Storytelling in Different Business Functions
Marketing
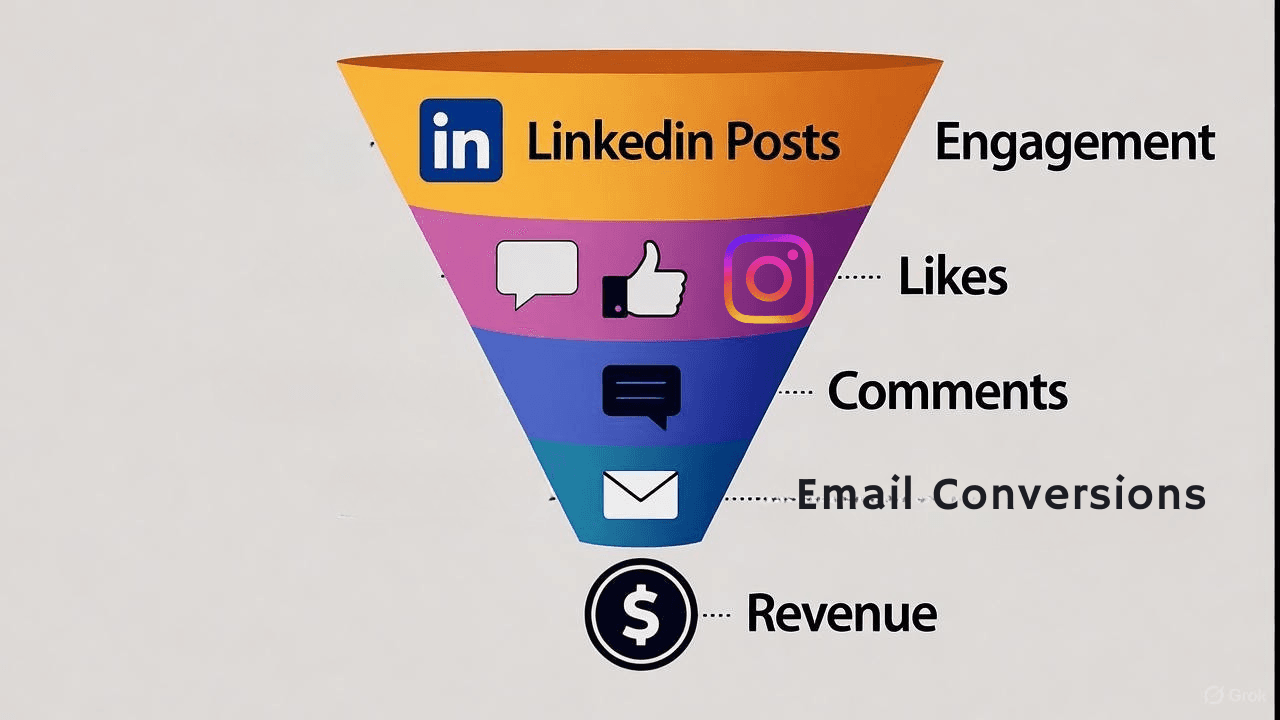
From campaign performance to customer segmentation, marketing thrives on stories. For example, instead of showing just a funnel chart, you might explain:
“Our highest-value customers engage first with LinkedIn posts, then convert after three email touchpoints — suggesting we should prioritize LinkedIn ad spend.”
Finance
In financial planning, storytelling might mean connecting budget overages to operational bottlenecks, then linking them to supply chain issues surfaced in ERP data.
Operations
Here, a narrative can reveal inefficiencies and connect them to process improvement opportunities thereby blending insights from ERP, inventory management, and IoT sensors.
How AI and Augmented Analytics Enhance Data Storytelling
As covered in our Top BI Trends for 2025 article, AI now automates:
Insight detection
Trend summarization
Predictive forecasting
But although AI may hint at the plot, humans still have to deliver the story — deciding what findings are most important, and presenting them in a way to share with others.
Challenges in Data Storytelling
Even with modern BI tools, companies face common hurdles:
Data silos — Without proper integration, stories are incomplete.
Poor data quality — Mistrust in numbers undermines the narrative.
Overcomplicated visuals — Too many charts confuse instead of clarify.
No audience consideration — A technical deep dive won’t work for non-technical stakeholders.
Overcoming these requires good data governance, Security, Compliance because trust in the data is the foundation of every story.
Practical Tips for Crafting Better Data Stories
Know your audience - Tailor language, visuals, and detail level accordingly.
Use the right visuals - Match chart type to the insight, not the dataset.
Simplify the message - A single story per presentation is more effective than a scatter of unrelated insights.
Leverage interactivity - Power BI slicers, filters, and drill-throughs let stakeholders explore their own “subplots.”
Connect insights to business goals - Show direct impact on KPIs.
Conclusion
In 2025, data storytelling is no longer optional, infact it’s the bridge between raw analytics and strategic action. Whether you’re using Power BI, Tableau, or any other BI platform, your goal is the same: turn data into narratives that inspire change.
The best stories blend integration (so your data is complete), governance (so your data is trusted), and visual best practices (so your insights are clear).
By connecting storytelling to other pillars of BI i.e from trends and governance to integration strategies and ROI analysis — you not only make your insights actionable but also ensure your analytics practice remains a core driver of business success.